

In a major three-part investigation into the stark realities of training racehorses in Britain for the biggest and smallest stables, Daniel Ross delves into nearly 20 years of British Horseracing Authority statistics. Here is part one. Part two will be posted on Friday.
For obvious reasons racehorse-training is absent from the canon of get-rich-quick career opportunities. Offsetting training fees and prize money earnings against the costs associated with buying or renting a yard, the upkeep of gallops, staff, feed, yard equipment, travel, tack, bedding, and all the other unavoidable stable expenses leaves most trainers hunting the sofa cushions for spare change at the end of the month.
Nor is this a modern phenomenon.
In this article from nearly 20 years ago, John Gosden is quoted as saying that “80 percent of trainers” in England are insolvent. “If you cashed them tomorrow at the bank you would be in a considerably negative situation,” he added. According to many trainers currently operating, the situation has since worsened.
But has it?
Is, as some fear, the economic climate getting progressively tougher for the UK’s smaller operators? And, conversely, are the nation’s largest stables consolidating their power at the head of the table?
U.S. statistics
This argument — that so called ‘super trainers’ are monopolizing the industry — has circled in the U.S. for decades, which is why, last year, TRC dug down statistically into a topic that had been hitherto tackled largely anecdotally. What did we find?
That between 2007 and 2016, the nation’s largest stables had remained steady in number, while the number of smaller stables, by comparison, had dropped off precipitously.
What’s more, these super trainers in the U.S. have been accruing larger percentages of prize money, while trainers at the other end of the scale saw their share of the overall prize money shrink.
UK statistics
To see whether the same dynamic is at play in the UK, we asked the British Horseracing Authority (BHA) for data on the number of starts and the amount of prize money individual flat trainers have accrued each year since 2000.
This is far from a comprehensive and definitive look at the issue. We don’t, for example, account for the number of individual horses each trainer started per year. Nor do we factor trainers’ overall stable numbers, which include horses that never saw a racecourse. These are all necessary data points if we’re to understand the situation fully. For example, in the U.S., statistics show that super trainers start their horses less often than the rest of the training population.
The following, however, still provides a useful glimpse into broader industry trends, and what it illuminates is how it appears that the UK’s biggest yards have, since the turn of the millennium, slowly cemented their position at the head of affairs.
(Note: the prize money totals represented here are slightly smaller than the BHA’s annual prize money totals, as our figures account for the amount deducted annually for industry training, valet attendance, the Professional Jockeys Association pension fund and National Association of Stable Staff.)
There are some significant differences between the U.S. and the UK’s racing industries. Unlike the U.S., where nationwide prize money levels, numbers of individual trainers making at least one start per year, and numbers of overall runners are on the decline, the UK has seen upticks in these areas.
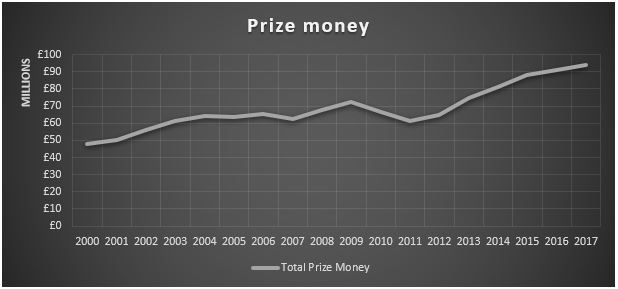
Prize money levels have steadily increased in the UK — from a little under £48 million in 2000 to a little under £94 million in 2017.
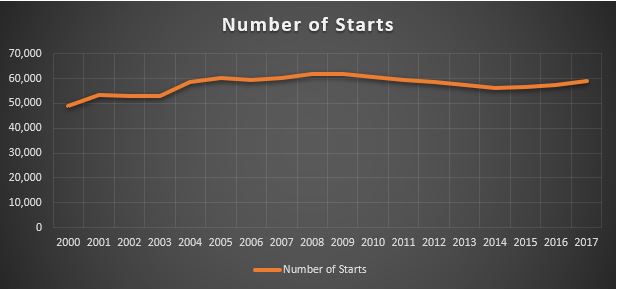
The number of overall runners has grown from 49,139 in 2000 to 59,039 last year — an increase of nearly 10,000 extra starts per year.
The number of trainers making at least one start per calendar year has also grown - from 520 in 2000 to 585 last year. However, that’s down from a high of 670 individual trainers in 2008.
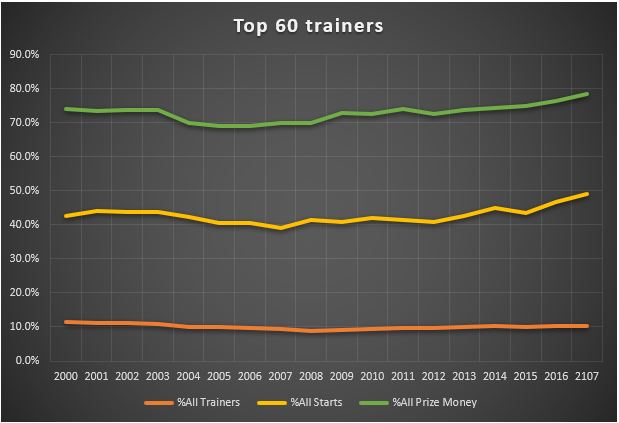
The top 60 works out as a percentage of overall trainers between nine and 11 percent, depending on the year.
From 2000 up until 2015, the percentage of overall individual starts per year made by the top 60 trainers in the country fluctuated a few percentage points above and below 42 percent. But the last two years have seen their percentage of overall starts grow appreciably.
In 2016, they accounted for 46.7 percent of all starts. Last year, it was 49 percent. This means that, last year, roughly ten percent of all trainers made nearly 50 percent of all starts.
Similarly, in terms of overall prize money, the percentage accrued by the top 60 trainers fluctuated until 2013. In 2000, they accrued 73.9 percent of all prize money — a number that had dropped to 69 percent in 2006. By 2013, the top 60 trainers accrued 73.6 percent of all prize money, after which, the trend has been an upward one.
Last year, the top ten percent of trainers won nearly 79 percent of all prize money.
To put this into context, in California where the industry is largely seen as struggling, the top 20 percent of trainers won nearly 84 percent of earnings in 2016.
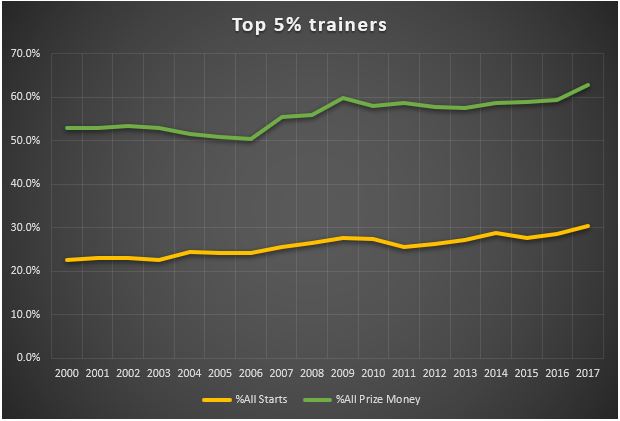
The top five percent of trainers in the UK comprise between 26 and 34 individual trainers, depending on the year.
Since 2000, these top five percent have seen their share of overall starts gradually increase (though it should be noted this hasn’t been a straight line of growth). In 2000, they started 22.5 percent of overall starts. Last year, they started 30.4 percent.
When it comes to prize money, the pattern isn’t too dissimilar.
In regards percentage of overall prize money won, the top five percent stayed below 53.5 percent until 2007. Their share of prize money even appeared to be shrinking up until that point. However, between 2007 and 2016, the amount of prize money won by the top two percent of trainers grew from 55.4 percent to 59.4 percent.
Last year, 29 individual trainers won nearly 63 percent of all prize money (what amounted to nearly £60 million).
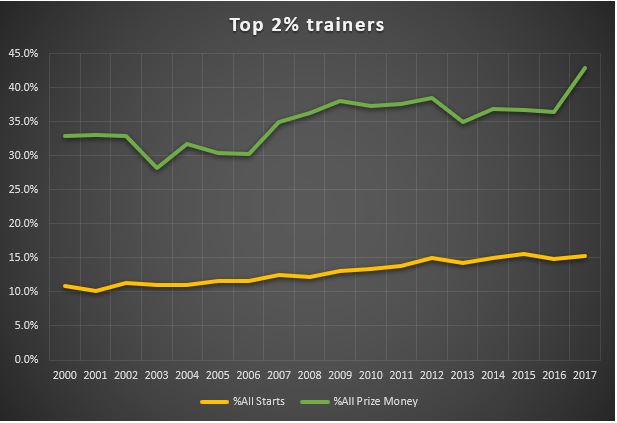
The top two percent of trainers is an understandably small number — between ten and 13 individuals per year.
Their share of overall starts per year has gradually increased since the millennium. In 2000, they accounted for a little under 11 percent of overall starts. Last year, they accounted for over 15 percent.
In terms of prize money, the pattern resembles that for the top five percent.
Between 2000 and 2006, the percentage of overall prize money accrued by the top two percent decreased from nearly 33 percent to about 30 percent (bottoming out at 28.2 percent in 2003).
Between 2007 and 2016, their slice of overall prize money fluctuated between a low of 35 percent in 2007 and a high of 38.5 percent in 2012.
Last year, 12 individual trainers won nearly 43 percent of all prize money (£40 million) — a jump of nearly six percentage points from the year before. This leap is likely explained by the record earnings of table-toppers Aidan O’Brien and John Gosden.
ON FRIDAY: Daniel Ross looks at events at the bottom of the trainer ladder, and break down prize money distribution over the last ten years in terms of class of race and individual racecourse.