
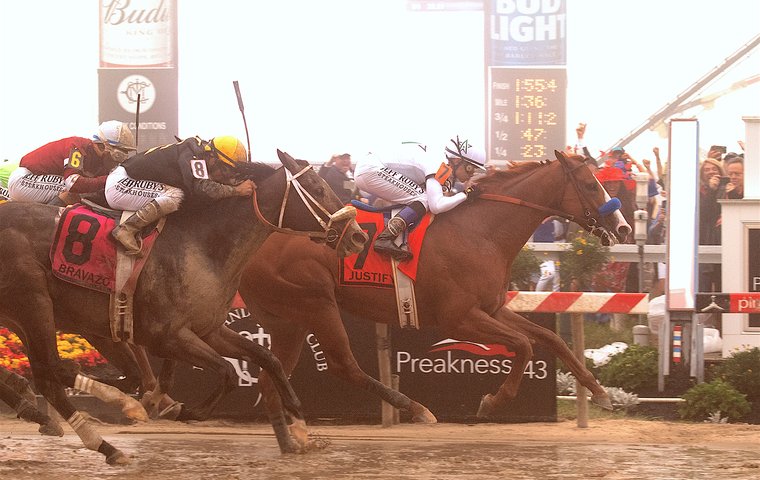
Long strides don’t necessarily bring victory. New stride data sheds light on why Justify won the 2018 Preakness — and why he almost lost.
Our obsession with stride length
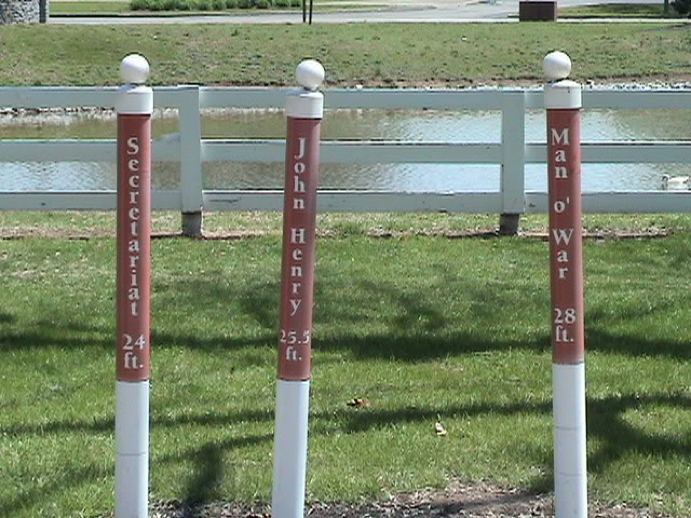
Racing fans are obsessed with stride length. At the Kentucky Horse Park, along the sidewalk toward Man o’ War’s tomb, a pole marker proclaims that the great stallion’s stride was 28 feet long. Nearby poles claim that John Henry’s stride measured 25½ feet, and Secretariat’s 24.
The Park may exaggerate Man o’ War’s stride. The likely source is a vague account in the November 6, 1920, issue of the Thoroughbred Record, in which an unnamed ‘Eastern expert’, using an unknown method to analyze ‘action photographs’ of Man o’ War’s match race with Sir Barton, reported that Man o' War’s stride had an “average length of … over 25 feet, while the maximum strides reached 28 feet.”
A better documented measure of Man o’ War’s stride, measured from hoofprints on the track after the 1920 Lawrence Realization Stakes, was 24 feet 8 inches.
The Horse Park’s claim that Secretariat’s stride measured 24 feet has stronger support. In 1978, MIT engineering professor George Pratt, writing in the American Journal of Veterinary Research with veterinarian James O’Connor, analyzed high-speed (300-frame-per-second) film of six-stride excerpts from races where Secretariat broke records in 1973. According to Pratt and O’Connor, Secretariat’s stride measured 24 feet 2 inches near the end of the Belmont Stakes and 24 feet 3 inches near the end of the Marlboro Cup.
The equine geneticist Byron Rogers later corroborated Pratt and O’Connor’s measurements by counting Secretariat’s strides between furlong poles in YouTube videos of the 1973 Kentucky Derby and Belmont Stakes. Rogers reported that Secretariat’s stride averaged 24 feet 6 inches during the fastest furlong of both races, and 23 feet 10 inches during the final furlong of the Belmont.
By my own count, Secretariat had a 25 foot 4 inch stride during the final furlong and a half of the Marlboro Cup, while his stablemate Riva Ridge had a 23 foot stride and finished second.
But are long strides enough?
But how impressed should we be by a horse with an average stride length of 24 or 25 feet?
It’s hard to know without comparing the strides of other racehorses, but until recently stride data on ordinary racehorses was hard to come by. That changed, though, in 2016, when a company called Total Performance Data, in partnership with Equibase, began counting the strides and tracking the distance covered by every horse at selected racetracks in the U.S. and UK.
Total Performance Data is something like an equine FitBit; the company’s GPS tracking devices, equipped with accelerometers, fit in horses’ saddle cloths and transmit live data using radio frequencies. .
Thanks to Total Performance Data, we now have data on millions of strides by thousands of horses — not just a few strides by champions in top races. Here, for example, are the average stride lengths for each half furlong of the 2018 Preakness Stakes — not just for the winner, Justify, but for all eight starters.
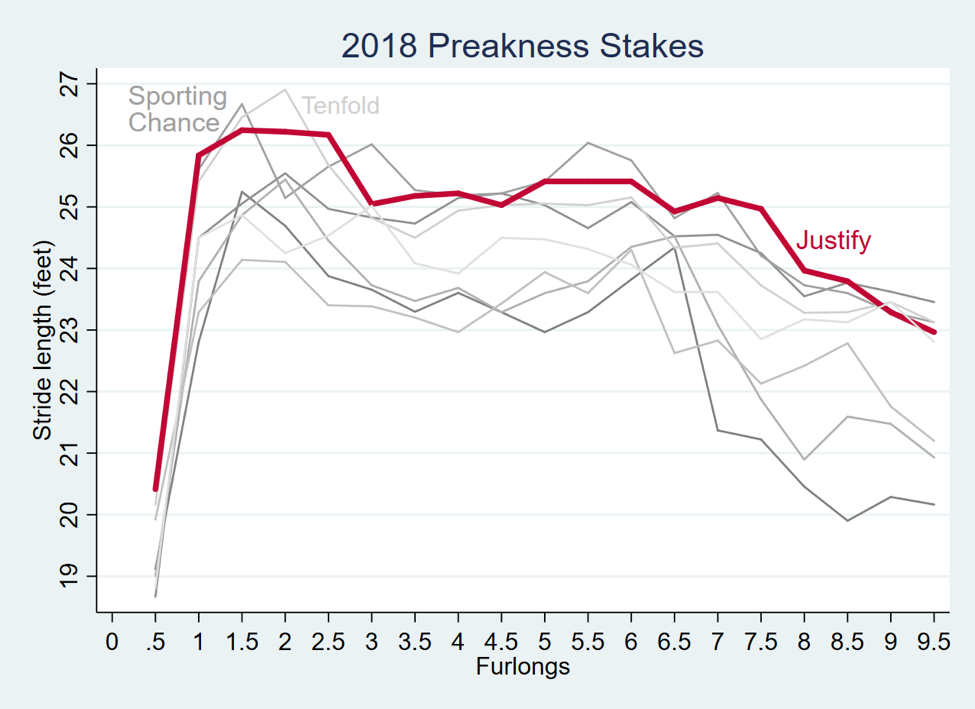
While accelerating through the first half-furlong, Justify’s stride averaged 21 feet. His stride reached 26 feet during the second furlong, settled to just over 25 feet through the middle half of the race, and then shortened through the last two furlongs, reaching 23 feet near the end.
Across the whole race, Justify’s stride averaged 24 feet 9 inches — a figure comparable to Secretariat, except that Secretariat could sustain his long strides into the stretch.
But Justify’s stride length alone did not win the Preakness. Another horse, Tenfold, had a longer stride — nearly 27 feet — for half a furlong early in the race. Tenfold couldn’t keep that up, but across the whole race his average stride length was just four inches shorter than Justify’s.
And Sporting Chance approximately matched Justify’s stride length throughout the race. On average, Sporting Chance’s strides were only a tenth of an inch shorter than Justify’s.
Yet Sporting Chance, with strides practically as long as Justify’s, finished sixth, while Tenfold, with shorter average strides, finished third. Evidently, long strides by themselves aren’t enough to win races.
Stride length vs stride frequency
What a horse needs for victory is not stride length, but a winning combination of stride length and stride frequency.
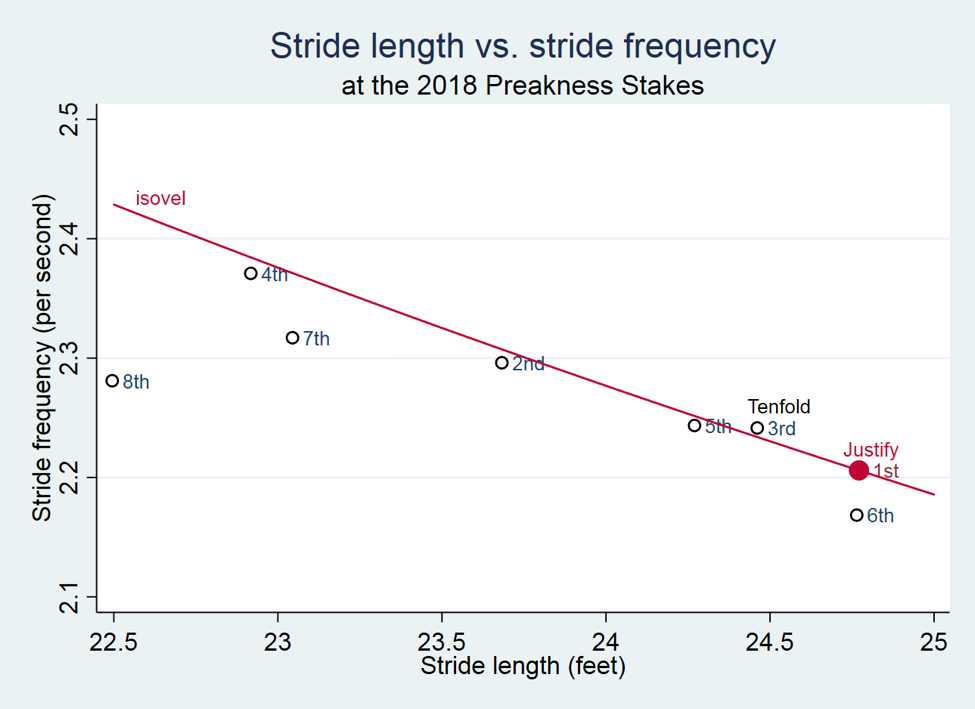
Here is a scatterplot of each horse’s average stride length and stride frequency in the 2018 Preakness Stakes. It shows again that Justify’s stride was approximately the same length as the strides of the 6th place horse, Sporting Chance. The reason Justify beat Sporting Chance was that Justify had a higher stride frequency, 2.21 strides per second, vs. 2.17 for Sporting Chance.
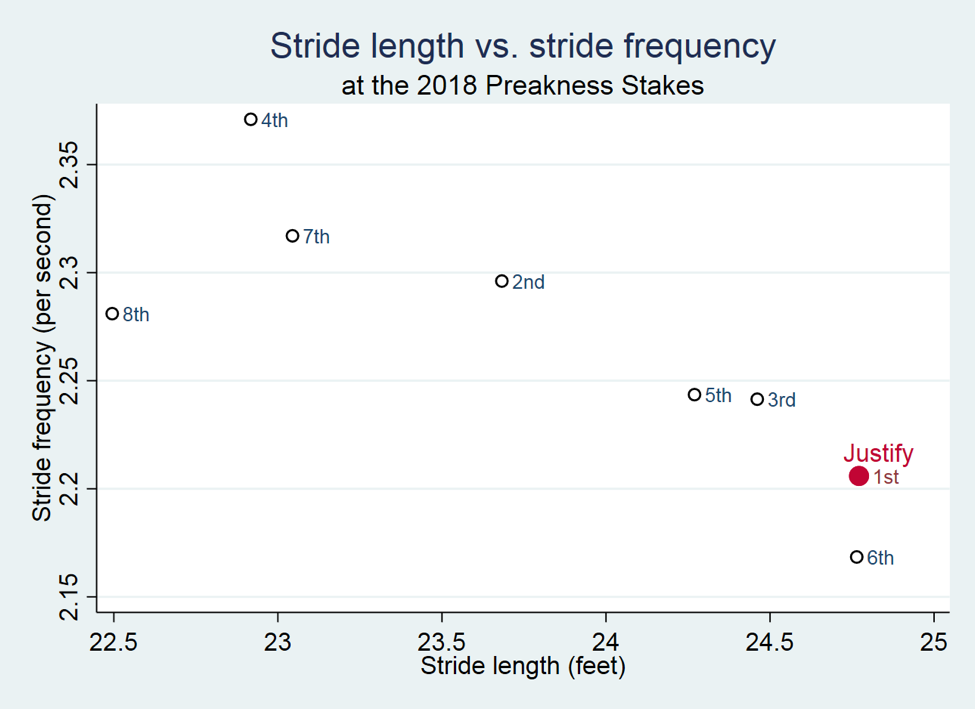
Aside from Sporting Chance, Justify had the slowest stride frequency in the field. He beat most of his quicker-striding competitors because of his greater stride length.
Stride length and stride frequency have a negative correlation. Long strides are rarely quick, and quick strides are rarely long. So a long-striding horse like Justify can win, but only if its strides are not too slow.
And a short-striding horse can win if its strides are quick enough.
The Australian mare Winx is a prime example. According to the physicist Graeme Putt, Winx’s stride measured just 21 feet 5 inches near the end of the 2017 George Ryder Stakes — but she won, going away, for the 16th of her record 33 consecutive victories. The second and third place horses in the George Ryder had strides a foot longer than Winx’s, but Winx beat them by taking her stride frequency up to 2.7 strides per second, while her rivals were stuck at 2.3 and 2.4, according to Putt.
You can see Winx’s accelerating stride frequency in the video below. Her head bobbed furiously as she caught up and then broke from the field.
A winning horse can have a long stride that isn’t too slow, a quick stride that isn’t too short — or anything in between that achieves a winning combination of stride length and frequency.
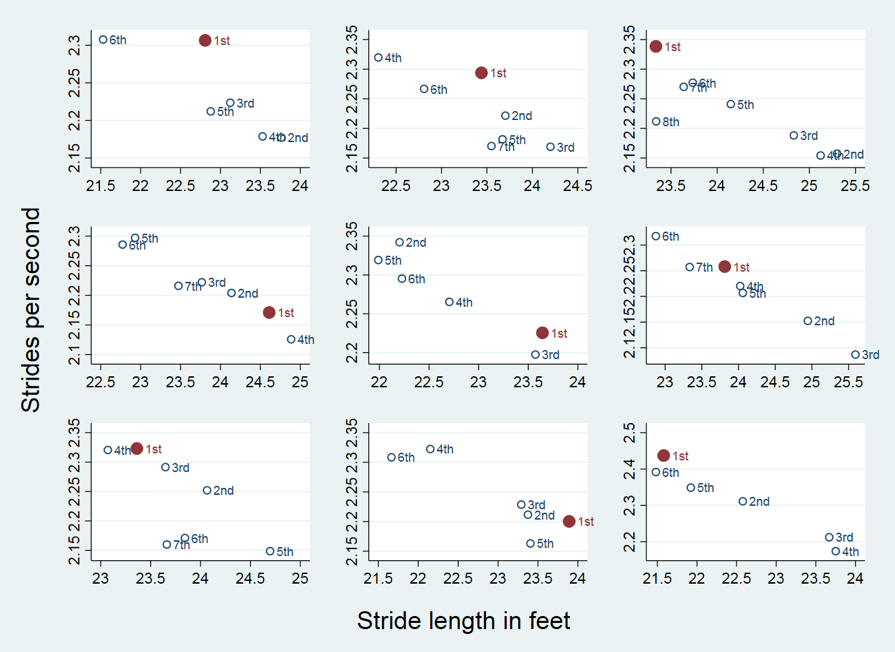
To illustrate the point, here are length-frequency scatterplots for nine mile races at Laurel — the track likely to inherit the Preakness Stakes when it leaves Pimlico in 2021.
Only two of nine races were won by the horse with the longest stride. Four races were won by the horse with the quickest stride — even though one of those horses had the shortest stride as well. The remaining races were won by in-between horses, whose stride was neither the longest nor the quickest, but achieved a nice trade-off.
A simple formula: length times frequency equals speed
The trade-off between stride length and stride frequency is mathematically simple. Their product is the horse’s speed:

In the 2018 Preakness, for example, Justify’s average stride length of 24.77 feet, when multiplied by his average stride frequency of 2.21 strides per second, gave him an average speed of 54.64 feet per second (or 37.25 miles per hour).
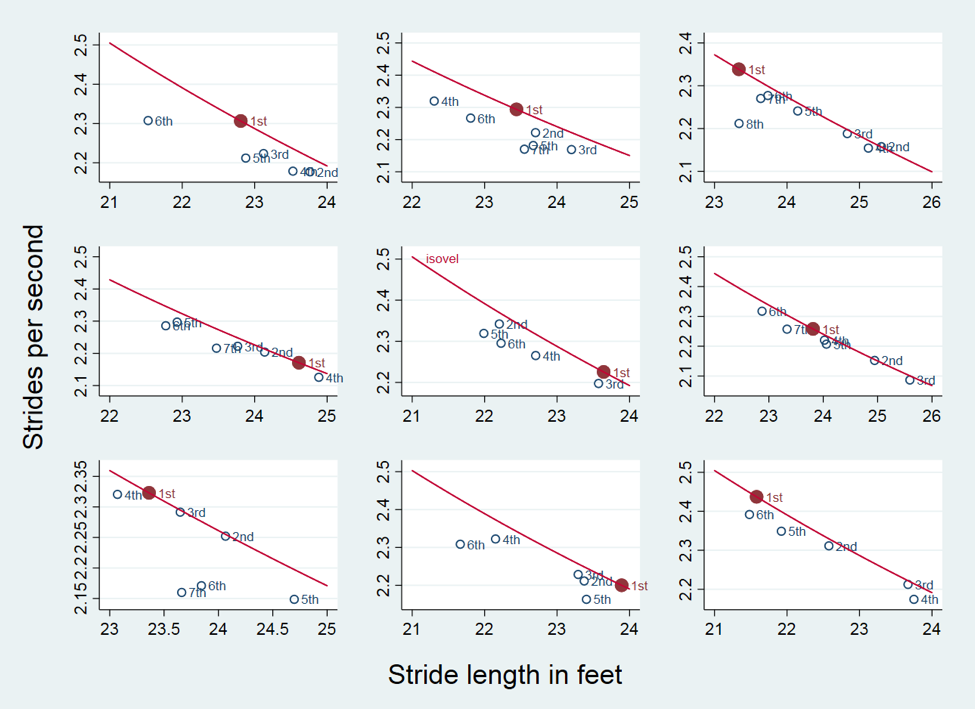
With this relationship in mind, let’s add to each scatterplot a curve that represents the possible combinations of stride length and stride frequency that could achieve the speed of the winning horse. Among the mile races at Laurel, for example, the first race was won by a horse with an average stride length of 23 feet and an average stride frequency of 2.3 strides per second. But the same speed could be achieved by a stride length of 22 feet with a stride frequency of 2.4, or a stride length of 21 feet with a stride frequency of 2.5 (though such a quick stride might be impossible to sustain for a mile).
Let’s call the curve that connects these possibilities an ‘isovel’, because any horse on it would have equal (iso) speed (velocity) to the winning horse.
Trip length can matter, too
In most races, horses that didn’t win will be below the isovel, because they did not match the speed of the winning horse. That’s true for the mile races at Laurel (above) but it’s not always true.
The 2018 Preakness Stakes is a striking exception. The third horse, Tenfold, is above the isovel, indicating that he ran faster than Justify.
It isn’t a mistake.
Tenfold’s average speed was 54.83 feet per second, which exceeded Justify’s average speed of 54.64. The reason Tenfold didn’t win was that he had a longer trip around the track than Justify.
In the Preakness, the official length of the race is 9.5 furlongs (6,270 feet), and the trip is exactly 6,270 feet for a horse who follows the ‘running line’, a meter off the rail. But both Tenfold and Justify spent much of the race running further outside — ‘four wide’, according to trip notes published by Equibase.
By the end, Justify had covered 6308 feet and Tenfold had covered 6341 feet. Tenfold’s longer trip prevented him from winning, even though he was actually faster in the sense that he covered more distance per second.
A final formula: why Justify won, and why he almost lost
The winning horse isn’t always the horse with the longest stride, or even the horse who covers the most ground per second. The winning horse is the horse with the shortest finish time, and finish time is given by a final formula:
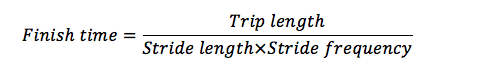
According to this formula, victory depends on some combination of trip length, stride length, and stride frequency.
In the 2018 Preakness Stakes, Justify didn’t win because of any single variable. He very nearly didn’t win at all.
Justify’s strides were long, but no longer than those of Sporting Chance. Justify’s stride frequency put him seventh out of eight horses. Justify didn’t even cover the most ground per second, but he had a shorter trip than the horse that did.
And that was how Justify won the Preakness Stakes. It was just a half-length victory, with three horses bearing down on him at the end — the least convincing of Justify’s five victories and the weakest link in his Triple Crown.
And the insights from Total Performance Data make it seem even closer than that.
Paul von Hippel (Twitter handle @equinometrics) is a professor at the University of Texas, Austin. Thanks to Will Duff Gordon, CEO of Total Performance Data, for sharing data used in this article. Thanks also to Roda Ferraro, Head Librarian at Keeneland, for finding historical accounts describing the stride of Man o’ War.