

As we continually stress, TRC Global Rankings is not an abstract exercise in playing with numbers like some ranking systems. We do not arrange the world’s leading Jockeys, Owners, Trainers and Sires according to some subjective prior belief over who is the best.
Instead, our focus is prediction. The order of each ranking is our best attempt to minimise the number of ranking violations taking place in races next week.
A ranking violation occurs when a lower-ranked competitor defeats a higher-ranked one, and the magnitude of this violation is considered proportional to the number of ranking points between them. So, the rankings try to find the optimal arrangement of competitors in each category to minimise the combined weight of ‘statistical shocks’ to the system.
We track these predictions, and continually try to improve their accuracy using machine learning.
Over time, our system learns from the data how to make better and better predictions, according to all the information about each competitor we can gather. What is their recent level of success? What is their baseline level over time? Is the competitor moving towards a new high or declining in importance.
Last week, there were 25 races around the world that counted towards TRC Global Rankings. There were three G1s: the Irish Oaks at The Curragh in Ireland and, in the USA, the Haskell Invitational at Monmouth Park and the CCA Oaks at Saratoga. Using the rankings we published the week before that – when these results were not known – the winners included:
- Nine (36%) ridden by the highest-ranked Jockey;
- Eight (32%) owned by the highest-ranked Owner;
- Ten (40%) trained by the highest-ranked Trainer;
- Two (8%) sired by the highest-ranked Sire.
In total during 2019, there have been 892 Group and Graded races which have counted towards TRC Global Rankings. The winners included:
- 177 (20%) ridden by the highest-ranked Jockey;
- 242 (27%) ridden by the highest-ranked Owner;
- 248 (28%) trained by the highest-ranked Trainer;
- 164 (18%) sired by the highest-ranked Sire.
In these 892 races run during 2019, there have been an average of 11.46 runners per race. So, random guessing in each race should yield a strike rate of 8.7%. In the trainer rankings, therefore, we are doing 3.21 times better than this.
The 20% of 2019 races that have been won by the TRC top-rated jockey is an unusually low figure. Further investigation suggests the reason for this may be a changing of the guard among the hierarchy of riders. Because, over the course of all our data since we first started making rankings at the beginning of 2014, the identity of the jockey has been the best single predictor of success when using the rankings.
This, of course, is only to be expected. The leading trainers generally use the leading jockeys, while the leading owners – who buy or breed stock by the leading sires – tend to hire the leading trainers. In this way, the four categories are far from independent of each other. At the top of this tree therefore are the jockeys, because they often have the most flexibility to choose the horse with the best chance in each race.
Before every race, the TRC algorithm combines the information of the four categories while doing its best to remove the effect of one category on the others.
So, we want to answer the question: what is the effect of a horse being by Galileo in winning a race, given that we already know it is ridden by RyanMoore, trained by Aidan O’Brien and owned by the Coolmore Partners. In the language of statistics, we seek to extract the marginal effect of each competitor – if we have enough examples in the data to be able to do this.
Getting technical just for a minute, we use a technique called conditional logistic regression, which is perfectly suited for this task.
We thought you would be interested in the weightings placed on each of the four categories because, independent of TRC Global Rankings, it may be of interest to anyone making predictions about races (especially if they are betting on them too).
So, here is the output of the conditional logit model, with the important numbers emphasised in the column under ‘z’. If you are experienced in academic statistics, you may find the rest of the numbers instructive also:
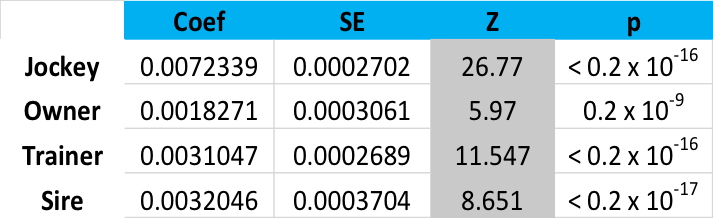
Modelled using all TRC data, then, the Jockey is 4.5 times more important than the Owner (26.77/5.97), three times more important than the Sire and 2.3 times more important than the Trainer.
Under the hood, the TRC Global Rankings algorithm uses this model – built prior to the week in which it is calculating and testing predictions (‘out of sample’) to produce a kind of odds-line for each race.
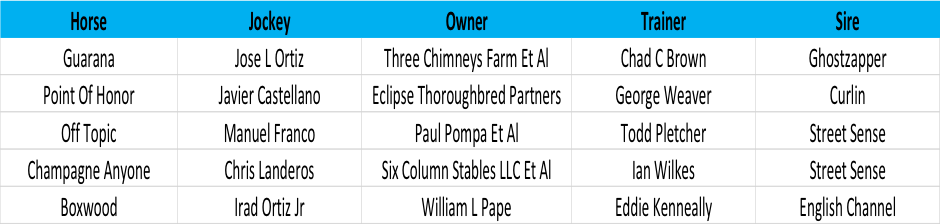
Here, for example, is that for the G1 CCA Oaks last week. First, the inputs:
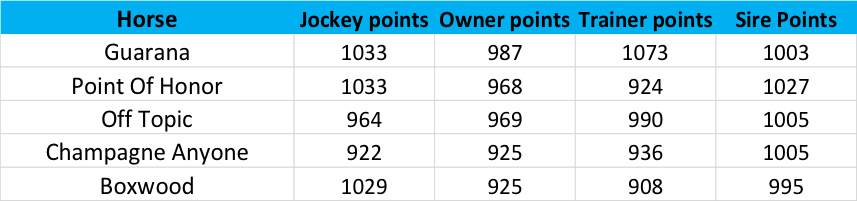
Then, how we rated these competitors in the TRC rankings prior to the race:
Finally, how we calculate the odds-line for the race:
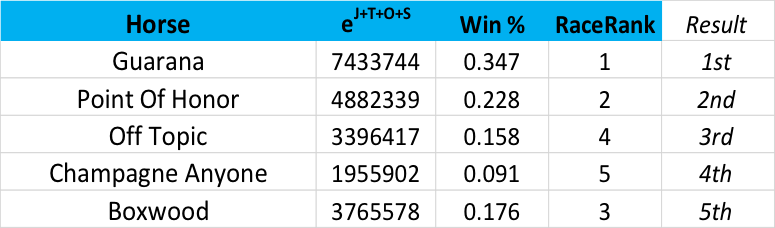
Here, the second column is the antilog of the ranking points of Jockey, Owner, Trainer and Sire multiplied by their respective coefficients. Then, the expected Win % for the race is just the proportion of the figure in the second column divided by the sum of all figures in the second column, a competitor’s win-share, if you like.
Now, of course, we would not want to be actually betting with this odds-line, because anyone laying 2/1 about horses like Guarana would end up going broke, but the point here is to provide an insight into how the rankings algorithm expects the race to play out - in the absence of any information about the identity of the horse.
We would like to make the expected Win % before the race as close as possible to that observed across all races and all competitors, using just the information provided by the rankings. When the system then ‘learns’ from the result, it automatically adjusts the rankings of all the competitors to reflect what happened. So, in this case, Jose Ortiz, Three Chimneys Farm, Chad Brown and Ghostzapper all get credit in proportion to their contribution statistically.
We also take into account placings behind the winner, recalculating the win probabilities each time and making an adjustment for the fact that the difference between lesser placings are not as important.
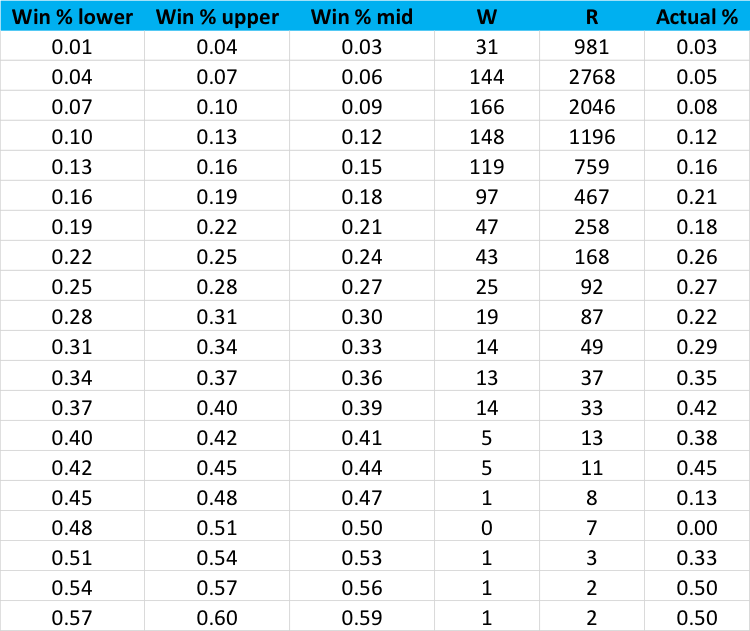
Let’s end by looking at how these forecasts have performed. If our system is tuned suitably, we should achieve both good forecast accuracy and calibration. In the following table, we have placed every one of the 8,987 competitors in the 894 races we have covered into one of 20 buckets, with the bucket determined by the Win % we forecast prior to the race.
The lower bound, upper bound and midpoint of these buckets is shown in the first three columns, with the actual Wins, Runs and SR in the final three:
To show the correspondence between our forecast of win probability and the actual strike rate realised, allow us to remove a couple of buckets towards the bottom on the table for which there are very few examples. The following plot shows model calibration:
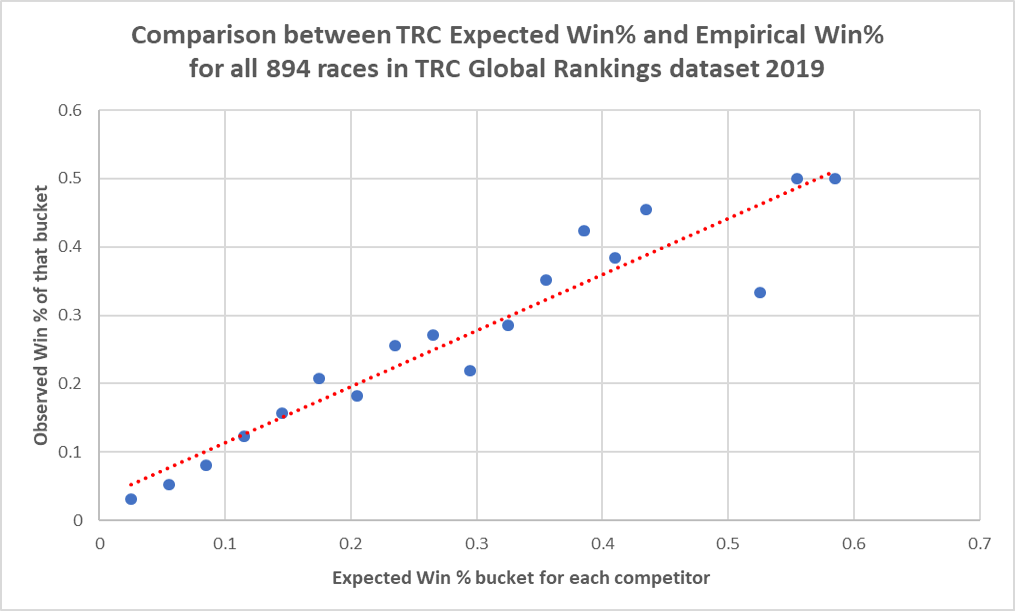
This seems to be relative satisfactory, though there is always room for improvement. For instance, for all forecasts in which we predicted a competitor should have a Win % in excess of 0.4, the observed figure was 14 wins from 46 races, or 30%. So, in the right-tail of the expected Win %, our forecasts may be too bullish.
This could be because our system cannot quite remove the dependencies between frequently occurring combinations, say the Moore-Coolmore-O’Brien-Galileo quartet referenced above. In this case, adding the marginal effect of each leads to overconfidence, even though we have tried to combat this via our methodology.
The work goes on to improve how TRC Global Rankings performs in out-of-sample forecast accuracy because this is the way we give the most meaning to the rankings we publish every week.