

Risk profiling at Finger Lakes significant contributor to drop
On Dec. 3 of last year, Christopher Kay, CEO of the New York Racing Association (NYRA), informed his board of directors that “we know that through the conclusion of our Belmont fall meet, our CRI [catastrophic rate of injury] continues to decline, which is very good news.”
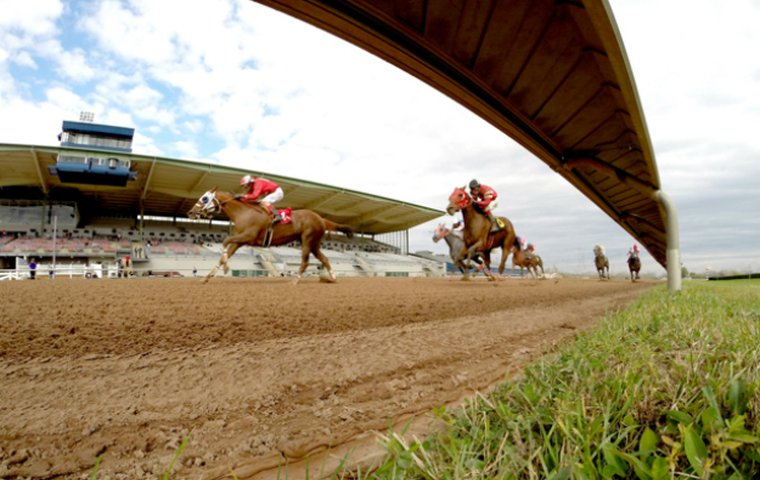
Later that same December day, racing at the NYRA’s Aqueduct Racetrack made its seasonal switch to the winterized, limestone-based inner dirt track. During the running of the fifth race, a claiming event, long shot Princes On Thelake suffered a fracture of her left front cannon bone and was subsequently euthanized. The death of Princes On Thelake would prove to be a harbinger of many more racing fatalities over the ensuing weeks and months at the venerable Queens oval. However positive the trend in equine safety at the NYRA racetracks may have seemed in late 2014, eight fatalities over Aqueduct’s inner track in the month of December alone would ensure a much different narrative.
A crisis-inducing spate of fatalities over Aqueduct’s one-mile inner dirt track is far from unprecedented. Memories of the death toll from the troubled winter of 2011-12, when 21 equine fatalities led the Governor’s office to appoint a New York Task Force on Racehorse Health and Safety, are fresh in the minds of current NYRA management and state regulators.
One particular legacy of the 2011-12 fatality episode is the online Equine Breakdown, Death, Injury and Incident Database (EBDIID) pioneered by the New York Racing and Wagering Board [now absorbed into the New York State Gaming Commission]. Released in April 2012, the database is a searchable compilation of equine injuries and fatalities at all 11 horse racing venues in New York (including four Thoroughbred racetracks) dating back to early 2009. Field staff at each racing venue forward incident details—including date, horse’s name, racetrack, trainer, jockey/driver, breed, and weather—to the Commission’s office to await verification and data entry. Fatality incidents are further categorized as having occurred during racing or training (an additional category—non-racing—includes all other types of fatalities occurring on racetrack grounds). Brief but informative details surrounding the context of the incidents are also furnished.
The action of the New York Racing and Wagering Board in releasing this database of heretofore closely kept information to the general public—not to mention lawmakers, journalists, and animal welfare activists—was a bold and radical gesture of transparency. “As the adage says: sunlight is the best disinfectant, especially for the state’s horse racing industry,” quipped then-chairman John Sabini. While it may be a stretch to think that the EBDIID has helped to cleanse New York racing of any undesirable elements, in a clear-cut way it does convey the message: we have nothing to hide. In an era when public trust is the new currency of business, the role of the EBDIID is self-evident.
To date, the EBDIID has not been replicated by any other horse racing jurisdiction in North America. The closest approximation - though functionally quite different - is the nationally-sourced Equine Injury Database (EID) launched by The Jockey Club in 2008. The EBDIID is public, granular, and searchable, but not easily summarized. The EID is private, focused solely on fatalities occurring during racing, and accessible only through previously prepared summary tables.
With five complete years of data now covered in the EBDIID, the opportunity to identify year-to-year trends, if any, presents itself. This chart depicts the number of equine fatalities occurring during racing or training at Thoroughbred racetracks in New York during the five-year time period using data from the EBDIID.

Considering the totality of Thoroughbred racing in New York, a general declining trend in the number of racing fatalities is clear with a marked decline, perhaps due to implementation of Task Force recommendations, from 2012 to 2013 (-29 percent). While the yearly number of training fatalities during the period does not vary appreciably, it claims an increasing share of total fatalities.
Drilling deeper to the racetrack level, the next chart depicts the number of racing fatalities at each Thoroughbred racing venue in New York over the five-year period using data from the EBDIID.

Aqueduct’s turbulent year of 2012 is plain to see. And despite a fatality-plagued December at the current inner track meet, the number of racing fatalities at Aqueduct in 2014 must be considered only typical of the most recent five years of racing.
The eye-catching trend in this chart -- including a 53 percent decline in racing fatalities from 2011 to 2012 -- centers on Finger Lakes Race Track. But absolute numbers of fatalities shed light on the situation only up to a point. Fatality rates (expressed per thousand starts) control for volume of racing and make inter-track comparisons meaningful.

These racing fatality rates warrant several, perhaps surprising, observations. The racing fatality rate of 2.25 per thousand starts at Aqueduct in 2014 is not in itself a cause for alarm. In two of the last three years, the racing fatality rate at Finger Lakes was substantially lower than the racing fatality rate at Saratoga (as well as all of the NYRA racetracks combined). The trend towards fewer Thoroughbred racing fatalities in New York from 2010 to 2014 is driven largely by much reduced racing fatalities at Finger Lakes.
Sharp-eyed stakeholders in New York racing will note that the number of racing fatalities and racing fatality rates reported here are higher than comparable figures reported in certain press releases, during some board presentations, or by The Jockey Club’s EID. The definition of “racing fatality” is somewhat open to interpretation, shaped by criteria such as type of fatal injury—musculoskeletal, cardiovascular, or other sudden event—or perhaps length of time between incident and death.
The EBDIID casts the widest net, so to speak, insofar as representing all racing fatalities at New York racetracks. The New York State Gaming Commission employs the following definition of racing fatality:
"An equine death that occurs for any reason (cardiac, breakdown, etc.) from the time the jockey mounts the horse for a race to after the race. If the death occurs off the track (e.g., days later off track or at another facility) due to an injury sustained during that race and the horse is euthanized or dies because of the injury, it is considered a racing fatality."
The distinction between musculoskeletal and cardiovascular catastrophic incidents, for example, though vitally important to those trying to solve the Gordian knot that is racetrack fatalities, may matter little or not at all to other interested parties. And importantly, the onus is on consumers of racing fatality statistics and reports to critically determine the validity of comparisons when subjective definitions of terms conflict.
Discussion of fatality rates and equine deaths at the racetrack carries the risk of becoming too clinical. What does a racing fatality rate of 2.00 per thousand starts really mean in practical terms? It simply means that, on average, a racing-related fatality occurs once every 500 starts. At a typical racetrack carding nine races per day, four days per week, with an average field size of eight runners per race, 500 starts will accrue roughly every two weeks. Over this two-week period there might be no fatalities, there might be two or more fatalities, but in statistical terms, there will most likely be one fatality. And the trend in U.S. racing toward creation of full-field, festival-style racing and “mega-cards” potentially reduces the race days needed to reach 500 starts to only four or five. Put this way, even a fatality rate of 2.00 per thousand starts [roughly the national average per the EID] becomes problematic.
Turning next to training fatalities, where comparable statistics are elusive and usually under less public scrutiny, this chart depicts the number of training fatalities at each Thoroughbred racetrack in New York over the five-year period using data from the EBDIIB.

It is immediately clear from this chart that Belmont Park and its one-mile training track is the epicenter of training for the three NYRA racetracks. It is also immediately clear that given the volume of racing (35 percent of all Thoroughbred starts in New York in 2014), there are surprisingly few training fatalities at Finger Lakes.
The next table presents “total” fatality rates, i.e., the sum of racing fatalities plus training fatalities per thousand starts for each racetrack in New York. These calculations (though unconventional since the starts-denominator becomes somewhat arbitrary in this context) further underscore the remarkable safety success at Finger Lakes during the past five years.
 Far removed from graded stakes races and NBC Sports camera crews, Finger Lakes Race Track is perhaps not the likeliest place for an equine safety success story to unfold. Compared with the NYRA facilities, horses running at Finger Lakes are generally of lesser ability. This racino-style operation in winery-dotted western New York state can be a viable destination for horses exiting the NYRA circuit—the chronically unproductive, or those that have lost a step or two due to injury or age—forming a rather challenging horse population from a safety perspective.
“There's no elegant solution, unfortunately,” Lisa Hanelt, DVM, an examining veterinarian at Finger Lakes, said of the complex, multifactorial nature of equine fatalities at the racetrack. “We try to promote a safe racing environment one horse at a time, one trainer at a time, one race at a time, one race card at a time.”
There may not be an elegant solution to equine fatality prevention, but Hanelt has been at the forefront of promoting a more elegant, sophisticated approach to identifying at-risk horses. Hanelt’s approach to modeling fatalities at Finger Lakes is easy to understand—use all available data including past performances to rigorously study and profile known fatalities, then try to identify other horses in the racetrack population that fit those profiles.
This evidence-based mindset does not exist in a silo at Finger Lakes—rather it is becoming part of the track’s culture. Finger Lakes has been accredited by the NTRA Safety & Integrity Alliance since 2011, and re-accredited according to more stringent standards in the years since. The track is also home to the Finger Lakes Thoroughbred Adoption Program - the first such initiative developed and headquartered with its own stand-alone facility on the grounds of a racetrack with joint funding from management and horsemen in the country.
“First and foremost, we are data-driven in our approach when we profile risk in horses and use data to drive policy,” Hanelt explained. “Everyone agrees it doesn't make sense to have a policy unsupported by fact. It is helpful to have numbers on hand when we've had to make decisions impacting the horsemen to which some may object.”
Dr. Hanelt’s model of fatalities at Finger Lakes uses general risk factors as a launching point. “In 2013, half of the horses who died racing at Finger Lakes came from elsewhere and raced with us three times or fewer,” she noted. “Knowing this, the logical response for the veterinarians was to raise our level of scrutiny for new horses coming to Finger Lakes and initiate more conversations with trainers about their new horses. We also know horses in their first season racing are at high risk for catastrophic injury, an industry-wide risk factor identified by Dr. Tim Parkin, an epidemiologist. This was a problem group for us as well, so we increased our level of scrutiny for maidens. The decrease in fatalities for these two groups was significant and a leading factor in the decrease this past season.”
But a safety strategy grounded by data needs another crucial component to succeed: the human participants. “There is no simple solution to reducing catastrophic injuries, and there will be no improvement at all if the horsemen aren't invested in the process,” Hanelt admitted. “Trainers now openly mention being new as a risk factor because we talk about it routinely, and I think they talk about it with their private veterinarians, too. It's a two-way street; trainers share strategies with the veterinarians for ensuring their horses are well-prepared to race, remain sound for the duration of the season, and receive rest when it's warranted. The veterinarians use what we know about risk from data when we discuss horses with trainers. It's less personal and I think less offensive to say to a trainer, ‘We're looking at your horse carefully because we're extra-careful with all of our maidens [or new horses].’ It brings the temperature down in the barn, or at least, that's the intent. Trainers are practical people, and enthusiastic about putting their knowledge to good use.”
The dearth of training fatalities at Finger Lakes might be explained, at least partially, by a horse population that simply races more often. But even here the opportunity for knowledge discovery presents itself. “Our horses train, though those who run more frequently probably train less frequently,” Hanelt said. “A number of people are interested in this problem and are looking at the relationship between training furlongs, racing furlongs, and risk of injury or death. We'd like to believe our figures reflect our efforts to encourage a horse-protective racing environment.
“Finger Lakes being a small racetrack is a major advantage,” Hanelt continued. “It allows for relative ease getting all stakeholders together in the same room to discuss potential issues and come to solutions. Everyone from our CEO down is invested in making the best decisions for Finger Lakes' horses.”
As the old racetrack axiom goes: “A good horse can come from anywhere.” Good ideas that achieve results can come from anywhere, too. Finger Lakes’ data-driven approach to reducing equine fatalities shows results that are clearly evident in the data outlined above. While it is a small track with a relatively contained horse population, their direct approach to modeling fatalities could easily be expanded to a larger circuit. While fatalities across New York state have been trending downward overall, only vigilance can help to maintain such results.
----------
With gratitude to the New York State Gaming Commission and The Jockey Club for making Thoroughbred fatality data available for further analysis, and Equibase for providing data on starts. These organizations bear no responsibility for the analyses or interpretations of the data presented here. Thoroughbred Racing Commentary bears no responsibility for inaccuracies contained in the original data sets.