

Are the winners of America’s Triple Crown races getting slower? Race analyst James Willoughby puts the stats under the microscope and makes a clear conclusion.
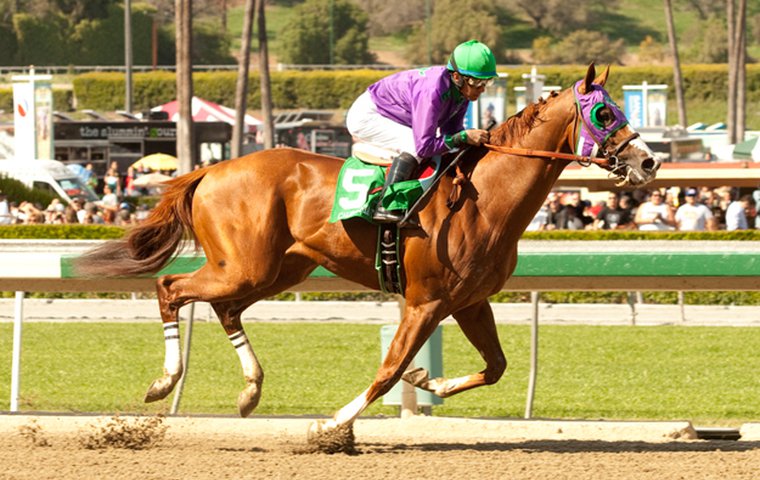
Entering the Kentucky Derby, there can be little doubt that California Chrome is the best 3-year-old colt in America. He looked brilliant in the Santa Anita Derby when recording the fastest time since 1998 – despite being handled considerately and geared down close home.
When he steps out on the Churchill Downs track on Derby day, California Chrome has a chance to parlay brilliance into a place in history. But to pass the test, he must meet a standard that has floored many potential greats of the past. And this is the Derby’s own greatness, the reality it has now imposed for 139 years. It takes even the most talented horse to the limits of physical tolerance, in the process creating a moving average of elite Thoroughbred athleticism since 1875.
The graph, which is the result of researching every one of the 139 Derby charts, shows how much the U.S. Thoroughbred has improved against the clock. But it also confirms that the expected winning time of the race has not only stopped improving, but may well be trending back upwards.

Just 83 of the 139 renewals have been on a track labelled “fast” at 10 furlongs – the race was run over a mile and a half for the first 21 years, and off-track conditions have persisted 35 times since.
The red dots represent the winning times of these fast-track runnings, scattered around a blue-coloured trend-line that, for the technically capable, is the result of polynomial regression. The grey area around the line is of width one-half of a standard deviation and is provided merely to show the rarity value of some of the super-fast winners who are picked out under the line.
The trend-line reaches its base in the mid-1980s. In order to provide the reader with confidence that this is more than just the result of mathematical manipulation, consider the fastest times for the other two legs of the U.S. Triple Crown: the Preakness Stakes and the Belmont Stakes.

The midpoint of the sample of fastest Preakness times is 1988, while the equivalent year for Belmont times is 1987. Yet, take note that only one Preakness since 1996 makes the sample, and only one Belmont since 1994. (The archaic form of completed fifths of a second must be used to compare equally the ancient and modern.)
Now, the reader savvy in the ways of interpreting racetrack data will be cognisant that race times without the context of track conditions do not strictly imply commensurate merit. It could be, for instance, that the racing surfaces at Churchill Downs, Pimlico, and Belmont have had extra cushion added to the pad for safety reasons. Indeed, there is some empirical evidence that this is the case.
So, let’s take yet another data-driven look at the capabilities of American racehorses, one that attempts to place race times in a context-neutral environment; in other words, a measure that allows for the variance in conditions and expresses achievement against the clock on a convenient scale – the Beyer Speed Figure.
With thanks to the Daily Racing Form, here are the Beyer Speed Figures for the top three finishers in each of the American Classics in reverse chronological order back to 1992:


This information is summarised in the three graphs below that use local regression in order to form a trend line:


Now, these numbers are introduced without formal knowledge of the consistency of Beyer Speed Figure computation. Some figure makers allow their numbers to drift – consciously or otherwise – even when they are based on par times. However, great respect is afforded by the writer to the integrity of the Beyer numbers and, once again, they seem to tell a similar story of decline.
Indeed, because the period under study in this case – 1992 to 2013 – is the right tail of the first graph produced in this article, it adds confidence that the trajectory of the blue regression-line is more likely to be correct.
It won’t surprise those who have already considered the subject matter of this article that the most dramatic decline in the Beyers has come in the Belmont. While it is not the explicit intent of this article to conjecture reasons for the shape of the data being studied, it seems truly seductive that American Thoroughbreds should possess gradually less stamina across time, given they are selected for breeding based on a racing environment that emphasises early speed.
However, it is hard to escape the conclusion that something else is at work. Neither hereditary differences nor pure randomness convincingly explains the downswing in quality of the last five years of the U.S. Classics. Are we seeing the outturn of tougher drug testing? Are we finding that horses bred from stock empowered to some degree by performance-enhancing substances cannot emulate the achievements of their forebears without the same chemical advantages? I include the question marks because this is received wisdom and I don’t have the evidence to make a more substantial claim.
As a handicapper, however, I have learned to emphasise staying power increasingly in betting on U.S. races at nine furlongs and above. If the pedigrees of top American Thoroughbreds have become unbalanced, the corollary is that it is far less likely they can run historically significant times in the Classics.
One final note: As a student and fan of American racing for most of my adult life, I sincerely hope that the decline under study stabilises or even reverses. And, as for California Chrome, if he can stretch the dazzling speed he showed in the Santa Anita Derby for another furlong, he is a candidate to romp at Churchill Downs. You can see from the chart of Kentucky Derby history that his best Beyers of 108 and 107 are better than all the last five winners of the Triple Crown’s first leg.