
In the second part of his look at the changing landscape of racing in California after the closure of Hollywood Park, Daniel Ross examines some key statistics and gets the views of a number of influential racing figures on the situation - and how to improve it.
In part one, How the closure of Hollywood Park is still hitting California hard, we voiced the concerns and impressions of those either shaped by, or else fashioning, the changes that have altered the landscape of racing in California since Hollywood Park closed.
We spoke with freshman trainer Dan Blacker, for example, who was driven into debt as a result of his small stable being divided between separate training facilities. Veteran handler and California Thoroughbred Trainers (CTT) president Jim Cassidy discussed concerns that “Super Trainers” are driving smaller operations out of business in California’s constricted racing environment. While racetrack surface expert Dennis Moore elaborated upon the impact that a widened racing calendar has had on Santa Anita’s main and turf courses.
Today, we aim to put some of the concerns that have been raised into statistical context while giving those interviewed a platform to propose possible solutions to the issues facing the industry, as a means of stirring debate.
Nothing exists in a vacuum, and the health and constitution of horse racing as a whole has been at the mercy of forces long in effect. Many trends playing out after Hollywood Park’s closure in December 2013 began their trajectory years prior, buffeted by a long series of events - the reduction of race-days per week, for example, or the passage of Senate Bill 1072, affecting, among other things, exotic takeout rates for purses.
It should also be noted that this is a far from an all-encompassing statistical look at the state of the industry in California. Rather, we have cherry-picked certain figures to highlight and to address some of the main concerns raised during this investigation. And so, to reiterate, our primary focus has been upon 2014 and 2015 in comparison to the years immediately before Hollywood Park’s demise, to get a sense of what kind of effect it has had on the sport in the Golden State.
Southern California
Trainers/horses
- Since 2008, between 330 and 370 trainers have started at least one horse at a Southern California track in any given year.
- Since 2008, the number of trainers winning 80 percent of the purses in Southern California has hovered around 16 percent (encompassing fewer than 60 trainers there). This trend hasn’t changed since Hollywood Park closed.
- However, the percentage of overall horses in Southern California making starts for these top percentile-winning trainers spiked after Hollywood Park’s closure.
- Between 2008-2013, those trainers winning 80 percent of the purses saddled, on average, 69 percent (and never more than 71 percent) of all horses that started in Southern California. In 2014 and 2015, they had 77 percent of all starters.After Hollywood Park closed, therefore, the relative percentage of starters saddled by these trainers jumped by more than 11 percent.
- As such, the top percentile-winning trainers are making more starts in Southern California.
Between 2008 and 2013, those trainers winning 80 percent of the purses made on average 62 percent (and never more than 63 percent) of the total starts in Southern California. Between 2014-2015, they made 66 percent of the starts in Southern California. After Hollywood Park closed, therefore, the relative percentage of starts made by these trainers rose by nearly 7 percent.
Solutions
Jim Cassidy (CTT president): Way back in the 70s, there was a 32-stall limit at these racetracks. It worked. I think they should re-introduce that 32-stall limit again. This would force the big guys to divide their 50-horse strings between here and somewhere like Galway Downs, and make room here [at Santa Anita] for the littler guys. We push for it all the time, but it just doesn’t happen.
Joe Morris (senior vice president of the Stronach Group’s West Coast operations): Down the road, we’d like to get a stabling facility with some number around 1,500 stalls, whether it’s industry-owned or we [the Stronach Group] own it. We think that’s important. That really secures our own future as we go forward, even if that was 10 years from now. We need more stalls. That’s why we’re investigating the possibility of adding more stalls at San Luis Rey.
Starters
- There were five more racing days and 30 more races in Southern California in 2015 over 2014, with nine more racing days and 70 more races at the two Del Mar meets compensating for four fewer days and 39 fewer races at the Santa Anita Fall meet.
- The average field size in 2015 (8.21) was the highest it has been since at least 2009 (8.09), and was roughly half a point higher than a seven-year low of 7.67, in 2010.
- The average field size in 2013 was 8.18.
- Looking at each course individually in 2015, the average field size differed greatly. Del Mar: 8.46. Santa Anita: 8.12. Los Alamitos: 7.31.
- The average number of annual starts-per-horse was up slightly to 3.64 in 2015 from 3.48 in 2014. That figure was down from 3.72 in 2013, and the highest annual starts-per-horse average of the past seven years: 3.85 in 2010.
Joe Harper (president of the Del Mar Thoroughbred Club): If there was anything I could do, it would be to make sure the roughly 3,500 horses here in California are all racing. We’re all feeling the lack of breeding shed activity, though I was delighted to see the number of foals increased recently. We rely heavily on the Cal-bred market, and that certainly still needs some improvement there.
We’ve been fortunate to get the field sizes that we have been getting here [at Del Mar]. But, I can tell you, it’s quantity more than quality that drives your handle, and the more horsesyou can get out the better you are – you can certainly see the difference in betting.
Handle
- Overall handle-per-race in Southern California increased from $818,669 in 2014 to $824,114 last year - a figure that has grown from a seven-year low of $749,587 in 2011.
- The average handle-per-race in 2015 was still down slightly on 2013’s total of $835,779.
- Average daily on-track handle on live races (which provides the greatest contribution to purses) dropped by 8.2 percent between 2014-2015 to $929,463 per day - the lowest average daily on-track handle on live races since at least 2008, and smaller than 2013’s total of $976,109.
- This decrease has been offset slightly by a two percent increase in average daily Advanced Deposit Wagering and a 1.4 percent increase in average daily out-of-state (export) handle between 2014-2015.
- California as a whole: according to figures announced at the latest California Horse Racing Board meeting, handle at all California racetracks declined 1.56 percent through the first four months of the year compared to the same period last year, despite eight more racing cards and three more night programs this year than last – a decline caused by changes to the schedule, according to CHRB executive director Rick Baedeker.
Combined handle through April 2014 was $978.3 million, compared to $994.4 million for the first four months in 2015.
(Note: every $1 decline in on-track handle would require $1.55 in new SoCal off-track handle, or an additional $2.69 in out-of-state handle, to make up for lost purse revenue)
Rick Baedekar: Have you been to Sammy’s, the restaurant mini-satellite in Orange County? You should go - it’s pretty exciting. There’s one part of the equation that hasn’t been focused upon. To me, mini-satellites are how the racetrack used to be on any given day - crowded with people who knew each other and loved the sport. And they're having fun. It’s tough to replicate that on a Thursday in a venue that holds 80,000 people.
(Note: There are currently nine mini-satellites operating in California, soon to be 10, possibly. The current cap on mini-satellites in the state is notched at 45.)
Andy Asaro (member of Horseplayers Association of North America): In my opinion, the only way forward for California racing is to proceed on a sustainable model based on earning revenues directly and indirectly from gambling on horse racing alone. I would argue that an optimal pricing experiment beginning with eliminating breakage on WPS [Win, Place, Show] and lowering exacta takeout to 16 percent is the best way forward.
Purses
- Total purse offerings have grown by over $14 million since 2010, while the number of races offered has fallen by 143 in the same period. As such, the average purse-per-race had increased from $43,362 in 2010 to $54,668 in 2015.
- While the average purse-per-race in 2015 was down slightly from the 2014 total, it was up from $53,673 in 2013.
- 2015’s average purse-per-day figure of $475,029 is down slightly on the 2014 total of $487,005. But it’s higher than $471,597 in 2013, and significantly higher than a seven-year low of $375,872 in 2010.
Nick Coukos (president of the Thoroughbred Owners of California): The TOC is in discussions with industry stakeholders, including the CHRB, on treating mobile bets made on the racetrack on a different basis in order to maximize the contribution to the purse account; pursuing and promoting legislation that would introduce ipoker in California that would benefit the racing industry as a whole; as well as evaluating betting denominations on exotic wagering, including but not limited to, superfectas, triactors and pick 6.
Jack Liebau (vice president of the Los Alamitos Racing Association): After having swept dysfunctionality out and civility in, I’d bring industry representatives having mutual respect for the views and interests of others together to formulate a long-range plan that would provide for the industry’s survival.
(Note: when pressed for specifics, Liebau stressed how nothing substantive could be accomplished until a more “open and honest” dialogue prevailed among the various parties involved in the decision making processes)
Attendances
- Average attendances have generally trended downwards over the past seven years (a scenario far from peculiar to California). In 2015, the average daily attendance in Southern California tracks was 7,973.
- In comparison, that figure was 8,509 in 2009. However, we should look at individual tracks.
- Santa Anita’s winter and spring meet showed increased attendance between 2014 and 2015: by 5.4 percent in winter, and by 8.9 percent in spring.
- Still, Del Mar and Los Alamitos saw attendance declines during that period. Both experienced near 30 percent drops in average attendance between 2014 and 2015 – Del Mar during the fall, and Los Alamitos during the summer.
Richard Mandella (Hall of Fame trainer): I’ll quote my owner, Mr. Ford: “Often wrong, but never in doubt.” With that in mind, if I were God for a day, I would put a spell over people to make them listen to each other in order to understand the problems in the industry, and come together. There’s also this: I, as a trainer, am invested in the industry, and concerned that we don’t have people at the races, and I find it offensive that companies like TVG are advertising an extra bonus if you bet with TVG, which to me says, “don’t go to the races.” We need to address that.
Aaron Gryder (then racing ambassador to both Santa Anita and Del Mar when interviewed last year): For a long time, we never had a lot of young customers. We didn’t have the young kids coming with their grandparents to the races. Now, Santa Anita and Del Mar have reached out a lot to the new generation to make up for that. Whatever it is, concerts in the infield, food-trucks, bringing celebrities and sports stars to the tracks, if we can get people to the races for the first time, they’re going to come back.
Northern California and the County Fairs
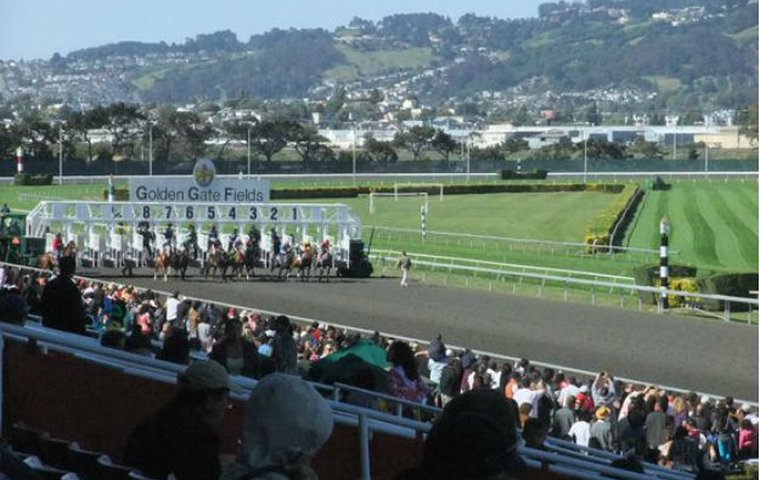
Golden Gate
- The average number of starters per race has decreased over the past three years. In 2013, it was 7.37. In 2015, it was 6.90. And, while that number has dropped again to 6.74 thus far this year, the first few months of the year tend to draw smaller fields. For example, for the same period of time in 2013, the average number of starters per race was 6.99. Last year, it was 6.56.
- Golden Gate has seen average handle-per-race increase over the past couple of years. In 2013, average handle-per-race was $185,045.33. In 2015, it was $198,638.14. Breaking it down, average live handle-per-race decreased, off-track handle-per-race stayed relatively steady, while ADW and out-of-state average handle-per-race has seen marked growth during this period.
- In 2013, live average handle-per-race was about $18,844. In 2015, it was $17,138. In contrast, in 2013, ADW average handle-per-race was $32,330. In 2015, it was roughly $43,249.
Craig Bernick (president and CEO Glen Hill Farm): I think California needs to be one circuit where they combine horses between north and south, have a calendar where we race five days a week with 10 races per day, and keep Golden Gate and Santa Anita open for training all year round. If you fixed up Golden Gate, invested money into the track, it could be a world-class facility – it would bring in so much money. And, frankly, Santa Anita never had the April, May and June dates - they were always at Hollywood Park. So, it’s not like you’re taking away their dates. I really think that’s the way to improve California racing.
Larry Swartzlander (California Authority of Racing Fairs chief operating officer): The number one thing is we race too much. We’re relying on five or six horse fields, and that’s no good for the industry. So, I’d look at the calendar and make changes so that there’s less racing [in Northern California], and then maybe at Golden Gate, shut it down for the winter months. We’ve got to think about the product, and work out how to make it an event that people look forward to attending.
County Fairs
The County Fairs face an uncertain future, what with a marked reordering of the calendar, as well as discussions to close certain facilities for limited periods. As with elsewhere, we’re unable to provide a comprehensive statistical overview of the air Circuit. Still, one standout worry among certain horsemen concerns horses that would usually race at the Fairs instead heading south, or north to Seattle.
- Indeed, the average field size has markedly decreased over the past three years. In 2013, the average field size was 7.21. In 2014, it was 6.85. By 2015, that figure was 6.65.
- Overall, handle-per-race for on-track betting has steadily shrunk over the past three years. In 2013, the average on-track handle-per-race was $34,110. In 2014, it was $30,015 per race. In 2015, it was $29,202 per race.
- Handle-per-race on bets wagered at Northern California off-track satellites has remained relatively steady, dropping slightly between 2013-2014, only to increase again in 2015.
- In contrast, off-track handle-per-race on bets wagered at Southern California tracks and off-track satellites has increased over the same period. For example, in 2013, the average handle-per-race was $54,880. In 2014, it was $63,589. In 2015, it was $69,694.
(Note: average handle-per-race figures were calculated using numbers from all Fair meets except those conducted at Fairplex and Los Alamitos)
Tom Doutrich (CARF Racing Secretary): Horse populations continue to deplete race meet to race meet. Owners, trainers, and horses have left to race in other areas such as Southern California, where horse racing is more lucrative, or even to states such as Washington, Arizona, New Mexico, Minnesota, and even as far out as the east coast.
Trainers are even opting to retire. The number one reason: purses. The economics of owning horses in N/C simply does not add up. Overnight purses have not increased in over 20-plus years. Parimutuel betting is not enough for us to stand on - we need help. The fairs are working hard on ways to stipulate are product.
Stuart Titus (former general manager and CEO, Humboldt County Fair Association): My sweeping change to improve the overall health of the county fair racing circuit would begin with a reconstitution of the California Authority of Racing Fairs. CARF needs to regain the leadership and participation of the Sonoma County Fair in Santa Rosa, even if that effort means replacing upper CARF senior management and member representatives on the board of directors of CARF.
Santa Rosa is the only fair with turf racing opportunities in Northern California. In addition, it is also the most preferred racing fair among owners, trainers, jockeys and other stakeholders.
In order for county racing fairs to contribute to the long-health of the sport, CARF must embrace the Sonoma County Fair, and reverse its well established pattern of supporting fairs with far less marquee value in Fresno, Sacramento, Alameda and Ferndale, the only four remaining live racing members of CARF, which once championed the cause of nine California Fairs.
(The above statistics were compiled using figures provided by a variety of sources, including Equibase, the California Horse Racing Board, CHRIMS, Golden Gate Fields, Thoroughbred Owners of California, and California Thoroughbred Trainers.)