


Seven years of running TRC Global Rankings has taught us a thing or two about world racing as played out on the track. Halfway through that period, it became obvious we should not be relying on anyone else’s performance ratings to power the classifications.
When we launched, it was with Racing Post Ratings (RPR) providing our necessary guide to the relative strength of races, but we wanted a computer to replace the humans. And now it has.
TRC Computer Race Ratings is now fully functional. We have rated our entire database since 2011 – the latest iteration literally at the speed of light – and this week the numbers replace RPR, causing some changes in the rankings. We have applied our new ratings retrospectively, in effect running the history of the rankings again. Hopefully, it is not too disruptive, but a small amount of continuity has to be sacrificed for the greater goal of automation.
You can read extensive details about the engine that powers TRC Computer Race Ratings in this article. As a taster for that, here are the Top 20 horses who lead our ratings, organised by what we call the Career rating, which is a portfolio assessment of each horse’s performance ratings, designed to evaluate a horse’s quality and consistency.
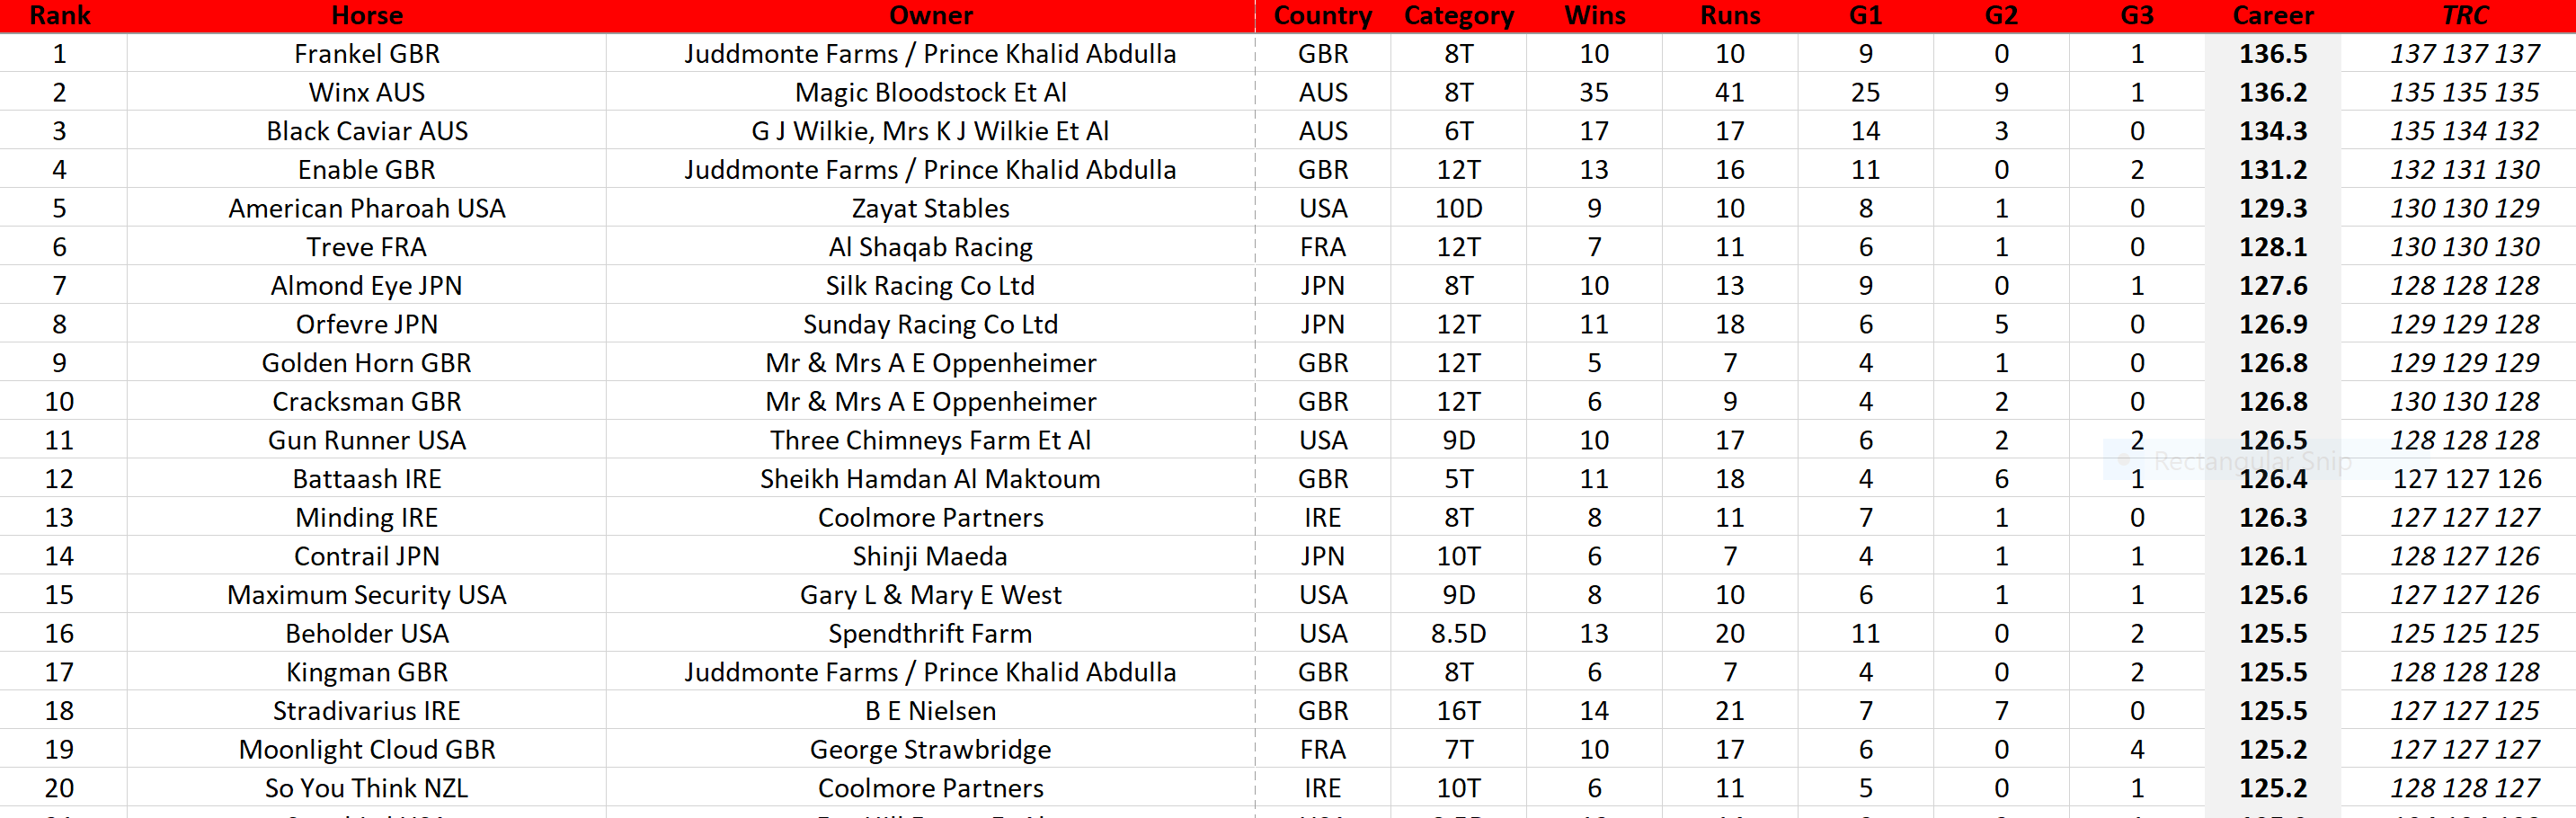
Next to the horse’s Career ratings are its best three performance figures, as assessed by our computer on exactly the same scale as the World’s Best Racehorse Ratings (WBRR).
There is one major difference, though. We rate fillies and mares as if they did not carry an allowance, so that the pure quality of a horse can be rated and ranked. We do it this way because it is more predictive – it produces the ranking of horses which is closest to how they actually perform next time. If a system rates a two-length winning female as if it could not have won by three lengths, it makes a systematic prediction error in future races. In other words, the exchange of distance beaten, weight carried and ratings points is non-linear.
The rankings themselves, in which we use the performance rating of a horse to weigh relative achievement, remain in the same categories: Horses, Jockeys, Owners, Trainers and three for sires: Sires (overall), Sires Dirt (dirt races only) and Sires Turf (turf races only). But there are improvements in the way they work.
First, with seven more years of data since we started, we have been able to tune them better to be suitably reactive to recent events. We were a little conservative to begin with, but now you should see the Points total for each competitor jump around a little more from week to week. Handling the way competitors ebb and flow in the sport’s hierarchy of success (for that is what we are measuring here – not talent) is like steering a car in a skid. You have to find just the right level of reactivity behind the wheel: too much is a greater crime than too little.
We now exclude competitors from the rankings if they fail to meet two new criteria: they must have been in competition within the last 200 days and they must meet a minimum number of races to be rated.
On the first criterion, we already used 200-day inactivity rule with respect to the Horse category. Now, however, it is extended to all categories because we find it leads to greater predictive success; remember, every change we make to our numbers has this in mind.
On the second criterion, the following is the minimum number of career performances we need to consider a competitor for a ranking: Horses 1, Jockeys and Trainers 25, Sires 75 and Owners 100. These numbers are based on two considerations: the true differences between competitors when you know how things turn out in future, and the volatility of that assessment as it is made continuously.
We admit to thinking that not doing this from the start was a mistake. Even though it is a central tenet of TRC Global Rankings to take sample size into account by means of using priors, competitors with only a few runs are just too volatile to be governed mathematically. Better for the system to reserve judgement because it makes the rankings as a whole better.
Now, here comes the bit we found the most interesting: through using a new set of performance ratings with a higher regard for certain countries, we found that there tended to be systematic changes to the rankings.
The best way to put this is that lower-rated competitors in the past tended to move up and European horses down a little. As you can see from the table above, in which 11 of our top 20 horses spent the majority of their career in Great Britain, Ireland or France, this hardly constitutes a sea change yet, but, through our numbers, we have learned that we were underrating countries like Chile, for example:
We have made several other technical changes to the rankings, but we will let these speak for themselves via the new classifications as you see them on the site.