

While the top few trainers have never had it so good, the opposite is true at the other end of the scale. The plight of the smaller handlers is spelled out in no uncertain terms in the statistics that Daniel Ross has been researching as part of this three-part report. Here, in part two, he looks at how those stats apply to life at the bottom of the trainer ladder. Part three will be posted on Sunday.
How Britain’s elite ‘super trainers’ are becoming even more dominant: read part one here
Trainers are stepping away from the sport due to the “economic factors” involved with trying to stay afloat. Perennially low prize money levels leave many UK handlers eyeing “superior prize money across the Channel”. Some industry organizations have connected the dots between mental health issues and the “financial pressures many trainers are under”.
While observations like these offer a useful glimpse into the winds shaping the nation’s training ranks, what do the numbers indicate as to their overall effect?
In part one of this series, we explored statistical trends among the nation’s largest stables and discovered that, compared to the turn of the millennium, the big-number operators now make a greater percentage of overall starts each year and are winning a greater percentage of overall prizemoney.
One particularly interesting finding: last year, just 12 individual trainers won nearly 43 percent of total flat prize money on offer (what amounted to roughly £40 million).
U.S. statistics
Nor is the UK alone in this regard.
In a recent TRC statistical analysis of the U.S. racing industry, we found that the nation’s biggest yards have seen their percentage share of prize money grow over the last ten years, while the reverse is happening at the opposite end of the scale.
For example, trainers with 50-99 individual starters per year saw their percentage of overall prize money shrink by nearly nine percent between 2007 and 2016.
UK statistics
To see whether the same dynamic is at play among the UK’s smaller yards, we sought British Horseracing Authority (BHA) data on the number of starts and the amount of prize money individual flat trainers have accrued each year since 2000.
As explained yesterday, the following isn’t a comprehensive and definitive analysis. We don’t, for example, take into account the number of individual horses each trainer starts per year, and we don’t factor into the equation their overall stable size — important data points in the broader picture.
Nevertheless, the following provides a window into emerging trends. And, while these trends aren’t as well defined at the bottom end of the sport as they are at the top, what the data suggests is that the UK’s smallest yards are beginning to see dwindling returns when it comes to their share of overall starts and prize money.
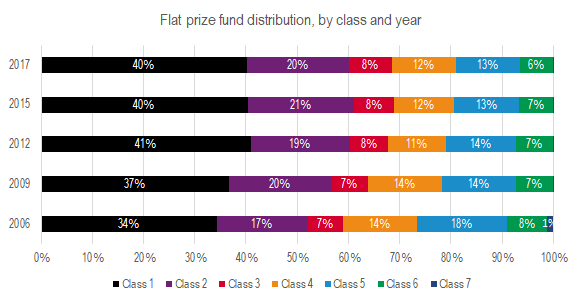
Prize money, for obvious reasons, is a useful barometer of industry health, and what the above table shows is that, over the past ten years, a greater overall percentage of prize money has been funneled towards the upper echelon races, with increasingly less for the lower tier contests.
In 2006, for example, 51 percent of overall prize money went to Class 1 and 2 races, and 26 percent to Class 5 and 6 races. Last year, 60 percent of overall prize money went to Class 1 and 2 races and 19 percent to Class 5 and 6 races.
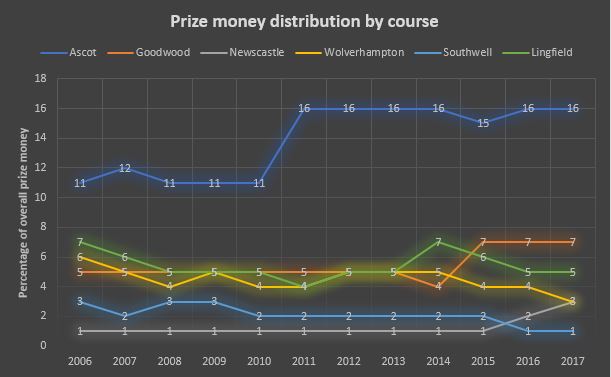
This same trend is reflected in the overall percentage of prize money distributed between tracks over the past ten years. Between 2006 and 2017, only three racecourses saw their share of overall prize money increase noticeably: Ascot (from 11 to 16 percent), Goodwood (from five to seven percent), and Newcastle (from one to three percent).
Otherwise, all other racecourses have typically seen their share of overall prize money remain pretty much the same, or drop a few percentage points (as with Wolverhampton, Lingfield and Southwell).
An important note: the new funding mechanism implemented earlier this year to boost prize money in middle and lower tier races will be discussed in part three, but 2018 figures weren’t available to see what impact this has already had.
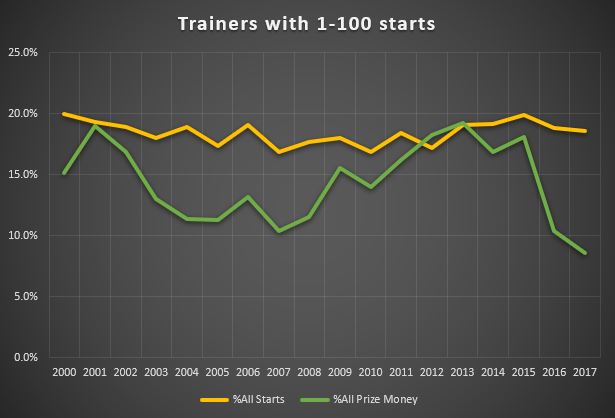
Trainers with 100 starts or less per year account for between 68 and 73 percent of all UK trainers, depending on the year. Last year, for example, they made up 72 percent of all trainers.
As the table shows, their percentage of overall starts has remained fairly steady over the years. In 2000, they accounted for 20 percent of all runs, and, while this figure dropped to a low of 16.9 percent in 2007, it has rebounded slightly, so that last year they accounted for 18.5 percent of runs.
In terms of earnings, they accrued 15.1 percent of all prize money in 2000 (what was then about £7.2 million).
Things looked promising between 2011 and 2015, when their percentage slice of overall prize money grew beyond the year 2000 benchmark (topping out at 19.3 percent in 2013). However, prize money percentages have fallen off noticeably the last few years: down to 10.4 percent of total prize money in 2016.
Last year, 72 percent of all UK trainers collected only 8.5 percent of overall prize money (what amounted to roughly £8 million between them).
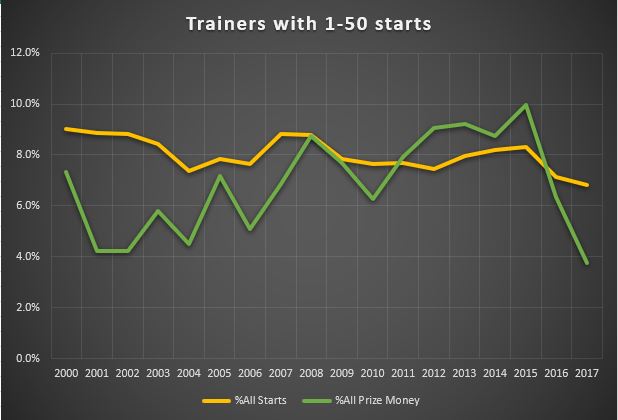
Trainers with 50 starts or fewer per year make up between 54 and 60 percent of all UK trainers, depending on the year. Last year, they accounted for 56 percent of all trainers.
As it was for trainers with 100 or fewer individual starts per year, the percentage of nationwide runs per year has remained fairly steady for trainers in the 50 or less starts per year category. While it did reach a 17-year low last year, this wasn’t a significant drop.
These small yards started nine percent of overall runners in 2000, the highest since the turn of the millennium. Last year, they accounted for 6.8 percent of overall runners.
Trainers with 50 or fewer starts per year have seen their percentage slice of prize money fluctuate over the past 17 years, making it hard to accurately gauge whether things have gotten generally better or worse since the turn of the millennium.
Between 2000 and 2016, they accrued a high of ten percent of total prize money in 2015, and a low of 4.2 percent (in 2001 and 2002).
Last year, however, marked an all-time low since the turn of the millenium: 56 percent of all UK trainers accrued 3.7 percent of overall prize money (what worked out to roughly £3.5 million between them).
ON SUNDAY: in the final part of this series, Daniel Ross talks to a variety of figures toiling away at the business end of the sport for their thoughts as to why the trends we’ve identified are emerging.